New paper on the reliability of Earthquake Environmental Effects for analyzing historical events
We live in an era of hypertrophic information; we are submerged by data and in many cases the limiting factor to analyses is computational power rather than data availability. This is not the case for historical earthquakes: coeval sources are usually fragmentary, and descriptions may not be crystal clear.
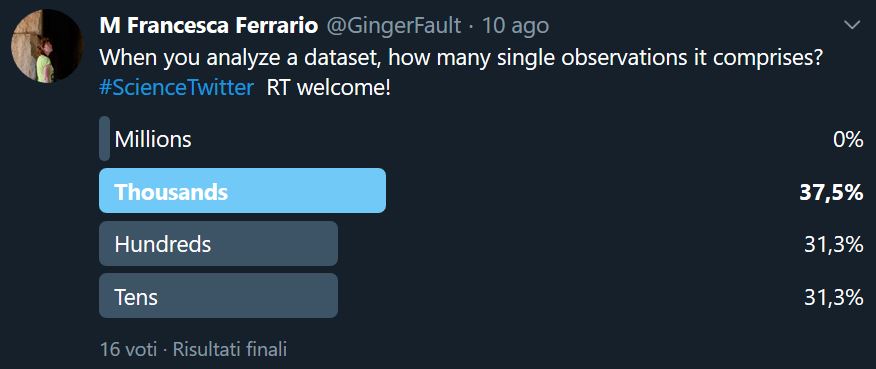
Depending on their specialty, Earth scientists may deal with thousands or just a dozen of observations. My Twitter followers may be a biased sample, but here’s what they think:
How is this related to historical earthquakes?
Deciphering the seismic potential of an area requires to analyze its seismic history; in regions of moderate seismicity, recurrence intervals may be as long as several centuries. Thus, we can’t neglect historical sources, because they are the only way to document the pattern of damage from past earthquakes. When data are sparse, scientists love to put together as many case histories as possible and to look for regularities.
Literary sources often report earthquake effects on the natural environment (landslides, liquefaction, tsunami); these Earthquake Environmental Effects (EEEs) are analyzed through a dedicated intensity scale, called Environmental Seismic Intensity (ESI). In our last paper, we analyzed 5 historical earthquakes occurred in the Southern Apennines between 1688 and 1980. We wanted to answer the following questions:
- Are EEEs reliable? Do they provide additional information with respect to traditional intensity scales (MCS or MSK)?
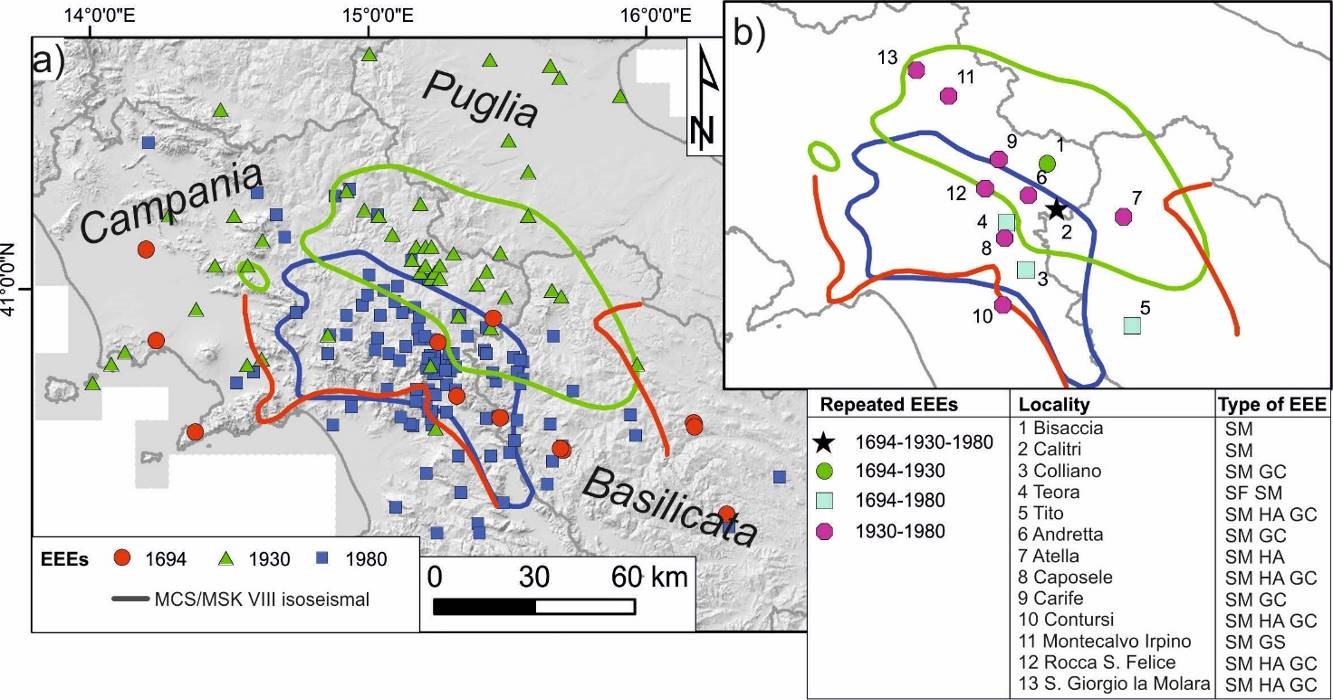
First, we assessed the spatial pattern of EEEs; we focus on the 1694, 1930 and 1980 earthquakes because they all hit the same region. Figure 2 shows the localities hit by at least two out of the three earthquakes: 5 out of the 14 localities where EEEs were reported in 1694 (i.e., 36%) were affected again by environmental effects in 1930 and/or 1980.
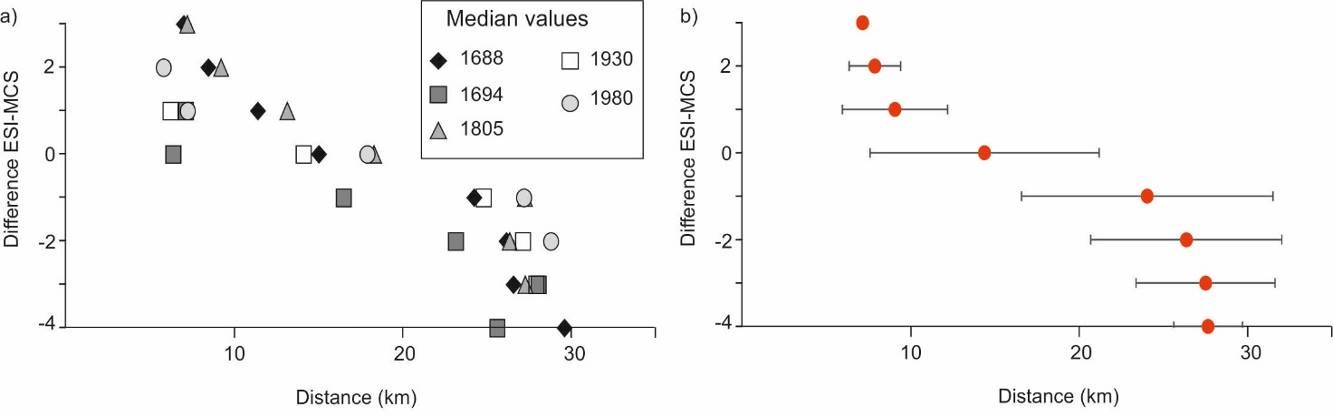
Then, we wanted to quantitatively compare EEEs with the pattern of damage derived from traditional intensity, which considers the effects on humans, the built and the natural environment. To this end, we used an intensity prediction equation specifically developed for the ESI scale (Ferrario et al., 2020). This equation allows to draw theoretical ESI macroseismic fields, even in the absence of sufficient data from the original sources. We found that at distances lower than 10 km, the ESI intensity is higher than MCS, while the opposite is true at distances higher than ca. 20 km (Figure 3).
Take home messages
Our results demonstrate that EEEs are reliable descriptors for assessing the size and damage pattern of an earthquake, especially in the near field. We argue that the reference practice in macroseismic assessment for future earthquakes should be to apply both the ESI and damage-based scales, which complement each other.
The paper is an open-access publication, available here.