Geolympics 3: Football field and macroseismic field
While waiting for the FIFA World Cup Final, here’s another #Geolympics post on football!
Intensity measures the effects of an earthquake on humans, the built environment and nature (earthquake-induced effects, such as landslides, liquefaction, tsunamis). Commonly adopted macroseismic scales (MM: Modified Mercalli, EMS: European Macroseismic Scale) comprise 12 degrees, from the lowest (perceived by seismometers only) up to the most destructive.
Felt area: the role
A macroseismic field is a map where regions experiencing the same intensity are contoured by lines (the isoseismal lines). How big is this field? It depends on several factors, including the magnitude of the earthquake and hypocentral depth. Shallow quakes are felt in a small region and are similar to goalkeepers: for the whole match, you can find them close to their goal. Seismic events in volcanic regions are goalkeepers.
Crustal events (depth ca. 10 km) can be a central defender or an old-style forward, living inside the penalty area. On the contrary, deep quakes (> 50 km) generally occur along subduction zones and are felt in wide regions; they are like midfielder.
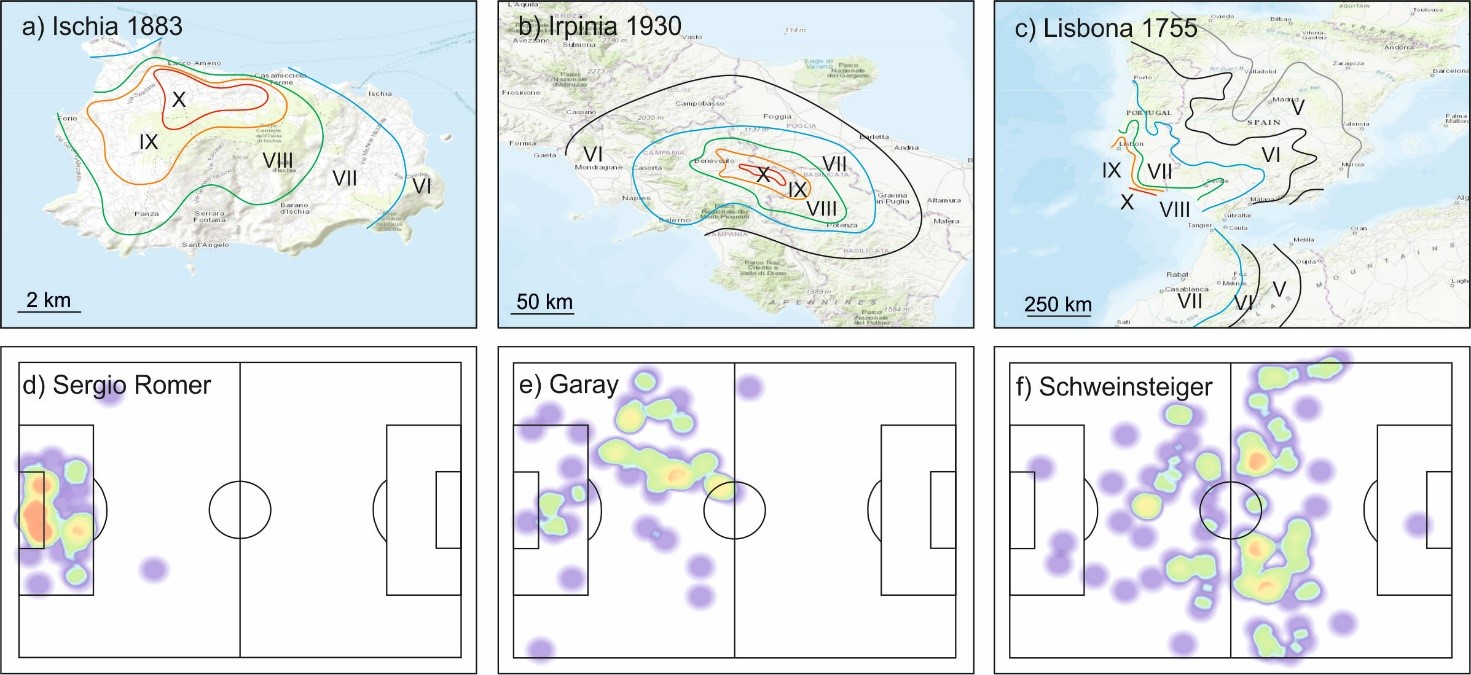
The top row of figure 1 shows the macroseismic fields of the earthquakes sharing the same maximum intensity (degree X), but very different felt area – please note each map has a different scale.
The bottom row shows the heat maps of 3 players during the 2014 World Cup Final, Germany vs Argentina. Heat maps represent the player’s position during the match: red zones are those preferred by each player.
Strong events: memorable events
Some events are fixed in history. I’m too young to have seen Maradona’s “Mano de Dios”, but I know every frame of that play. Similarly, some earthquakes and related phenomena changed the perception at a global scale: the 1755 Lisbon earthquake and tsunami, which shook large parts of Europe; the 1906 S. Francisco quake, which gave birth to the first model of earthquake cycle; the 1992 Landers (US) event, the first to be captured by satellites; the 2004 Sumatra and 2011 Tohoku tsunamis, which claimed hundred thousands lives and radically changed mitigation practices.
Historical seismology: scouting
The study of past earthquakes gives insights on the earthquake process and vulnerability changes occurred through time. This is particularly true when considering geological timescales: recurrence intervals are on the order of 10s – 1000s years, much longer than human perception or instrumental seismology.
Studying historical earthquakes is like scouting: collect information, verify its reliability, check the places looking at evidences still preserved in the natural and built environment.
The shape of macroseismic fields: wingers or centre midfielder?
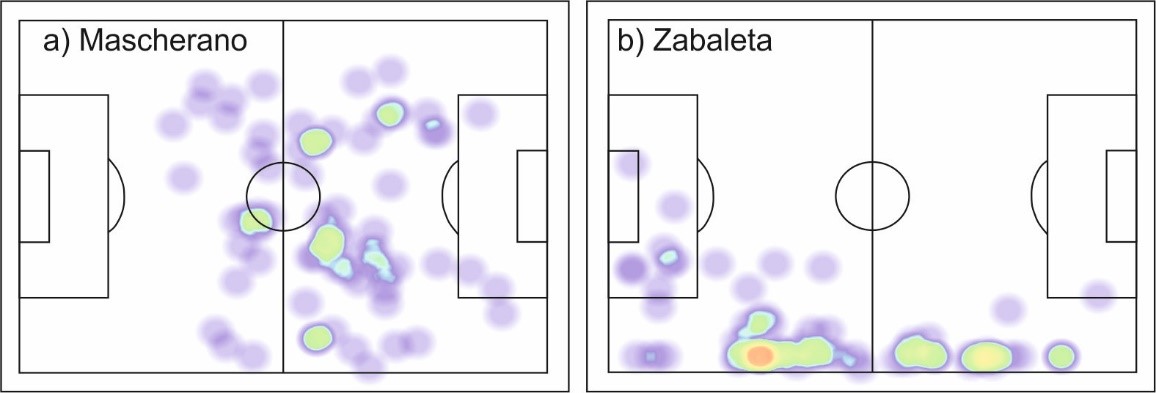
Some players move along the touchlines, others in the centre of the field. They have different positions and roles. Some macroseismic fields are almost circular (centre-players, like Mascherano in Figure 2a), others are more stretched (like Zabaleta in Figure 2b).
Complex macroseismic fields: tactics
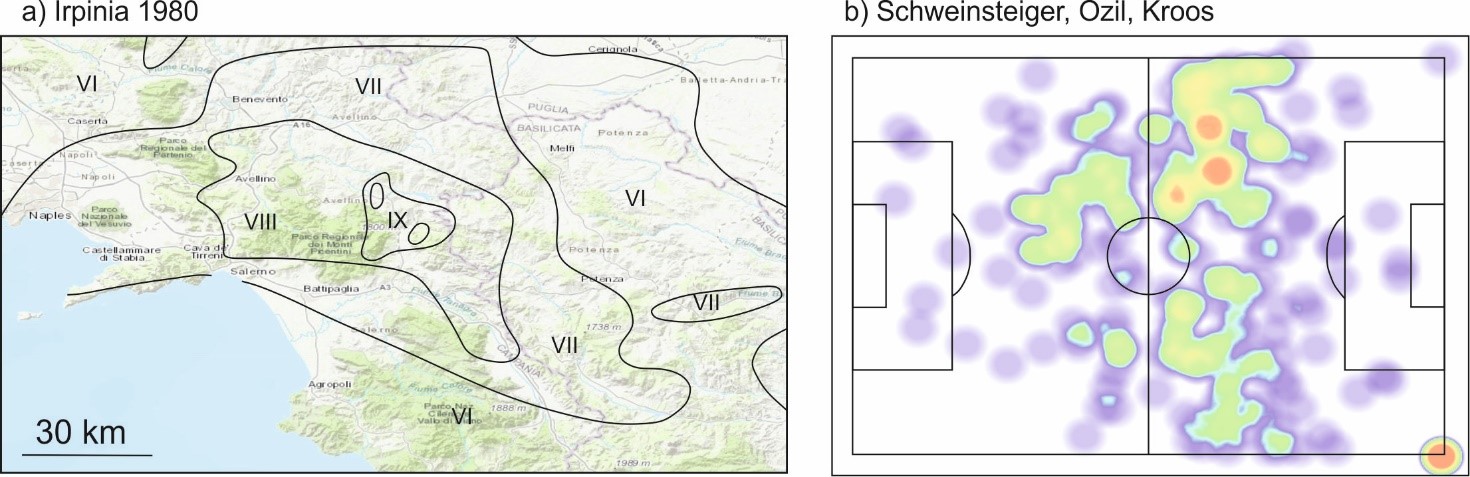
Each team has 11 players, but a 5-3-2 formation is not as a 3-4-3. Macroseismic fields can be extremely complex, with badly damaged regions interspersed in areas with lower damage. The 1980 Irpinia (S Italy) earthquake in Figure 3a shows two small regions that reached intensity X and a complex pattern of lower degrees. Heat map of football players can be complex too. Figure 3b shows the position of Schweinsteiger, Ozil and Kroos in the 2014 World Cup Final.
Sources: all football maps are from http://world-cup-2014.squawka.com/germany-vs-argentina/13-07-2014/world-cup/matches
3 risposte
I think the admin of this site is really working hard for his web page, since
here every data is quality based information.
Thanks a lot for sharing this with all of us you actually recognize what you are talking about!
Bookmarked. Kindly additionally seek advice from my website =).
We could have a hyperlink alternate contract among us
Thanks for sharing your info. I really appreciate your efforts
and I am waiting for your further write ups thank you once again.